SE-As-3
Draw a data flow diagram and a state transition diagram respectively for the following description
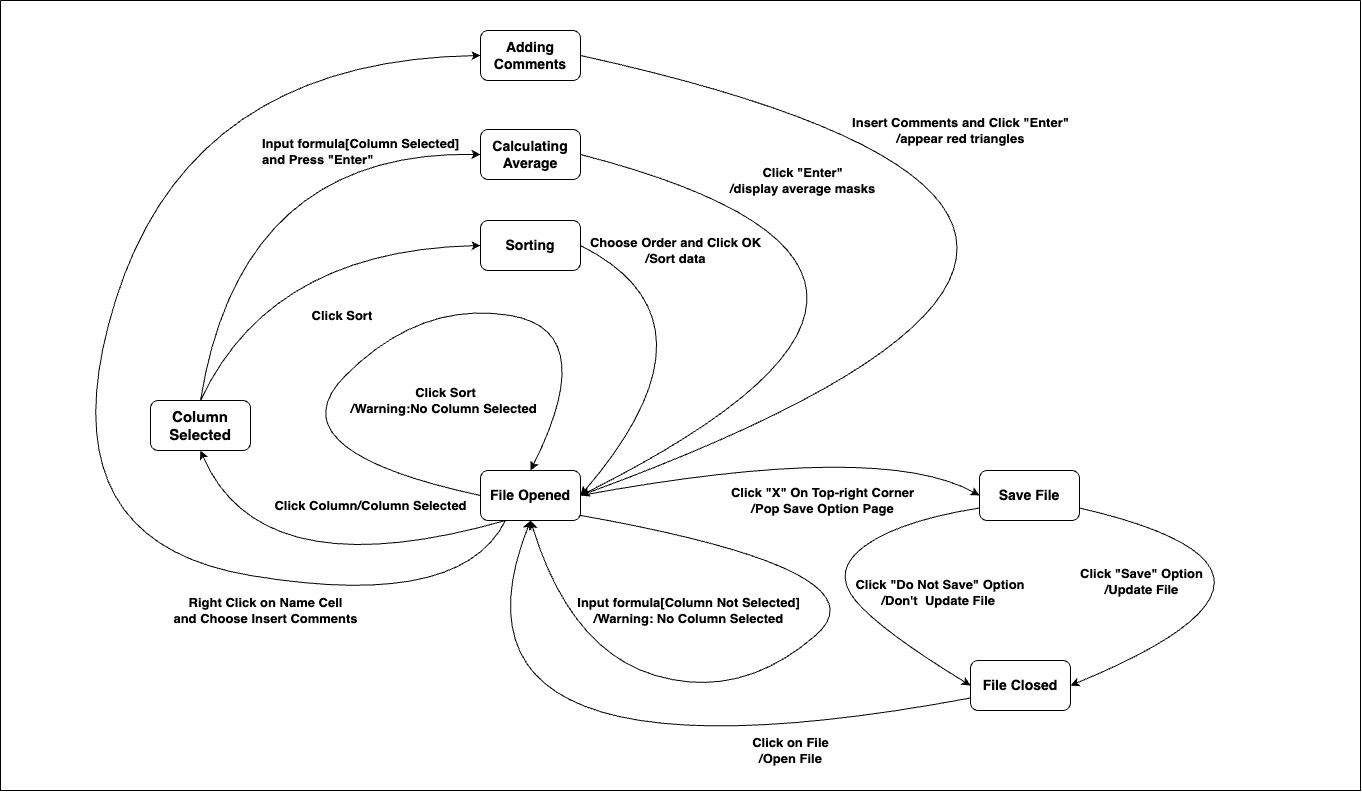
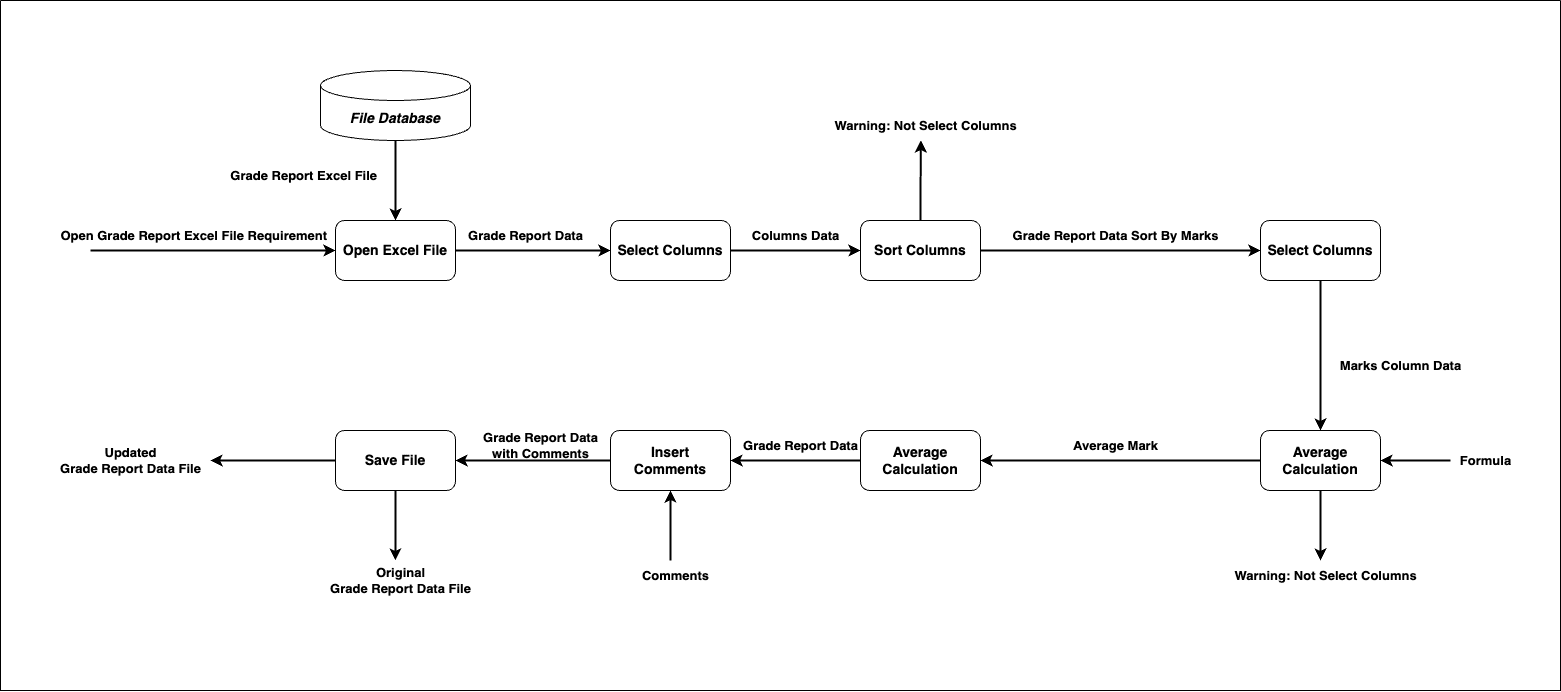
- Open a grade report excel file by clicking on this file in File Manager.
- In the open file, there are three columns: Name, ID, marks.
- Select these three columns in the sheet and click on Sort under the Data Ribbon. In the popped box, choose “Marks” in Sort by drop box and “From largest to smallest” under the Order, then click OK. The data cells will be sorted. If no columns are selected, then clicking “Sort” will cause a warning.
- Click on the cell below the bottom of the Marks column, input a formula to calculate the average of marks. During the formula input, the marks in column Marks need to be all selected. After finished the input of formula, press “Enter” in the keyboard, the average will be displayed. If the column is not selected during the formula input, a warning is given.
- Right-click on a cell in the name list, choose “Insert comments”, a box is popped, points to this cell. Write some comments then click “Enter”, the box will disappear and red triangle appeared on the top-right corner of the cell.
- Click X on the right-top color, a box pops up asking “Save” or “Do not save”. If “Save” is selected, file is updated; otherwise, file is not updated. No matter which is chosen, the file will be closed.
Data Flow Diagram
State Transition Diagram